

Table of contents
A big part of Checkly runs on AWS Lambda, but I never really discussed it in depth before on this blog. So here we go.
Topics are:
- A little bit on our Lambda setup.
- Why Lambda is an almost perfect match for SaaS. Especially when you're small.
- Why I don't use a "big" framework around it.
- Why distributed background jobs triggered by queues are Lambda's raison d'être.
- Why monitoring & logging is still an issue.
Note, I'm using "Lambda" here as a stand in for "serverless" in general. Many of the things discussed here apply to either Google Cloud Functions, Azure Functions and possibly Zeit although I've never used it.
👉 update 21-02-2010
We are moving our Lambda's to the Serverless framework right now. Serverless is officially not shitty anymore! yay!
Our Lambda setup
First something on how we use Lambda. Last week we went over 35 million check runs. All check runs for Checkly are on Lambda and have been for at least the last 12 months or so*.
We even have a vanity metrics section on the Checkly homepage that's updated pretty much live.

And this is just a sub set of all Lambda runs, as we have some other plumbing stuff running on Lambda too.
More data on our Lambda setup:
- We run three core functions in all AWS regions. They handle API checks, browser checks and setup / teardown scripts. Check our docs to find out what that means.
- All functions are hooked up to SNS topics but can also be triggered directly through AWS SDK calls. More on that later.
- The busiest function is a plumbing function that forwards data to our database. It is invoked anywhere between 7000 and 10.000 times per hour with an average duration of about 179 ms.
- We run separate dev and test versions of each function in each region.
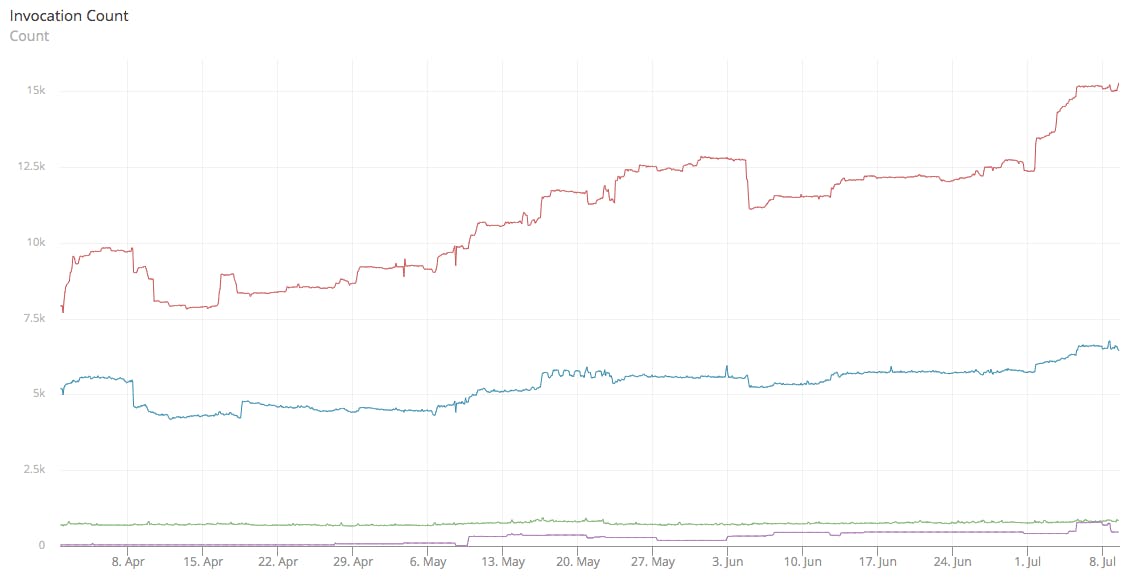
More vanity metrics. These are the amount of invocations for the three core functions and the one (busiest) plumbing function over the last three months, in total roughly 21 million invocations.
Note that the invocations are directly tied to how often Checkly allows you to run checks: every minute for API checks, every 5/10 minutes for browser checks.
You get it now. We use Lambda at at least some sort of scale. Onwards.
*We ran the browser checks on VM's with Docker before. Read this older blog post on how the VM/Docker solution worked.
Lambda 💕 SaaS
Lambda is a great fit for early, bootstrapped SaaS companies for these three reasons. At least they were for me:
- It keeps your variable costs low or non-existent. If no one is using it, you're not paying for it. Lookup CAPEX vs OPEX.
- If people start using your SaaS, the scaling is 100% transparent and automatic. No autoscaling groups, no
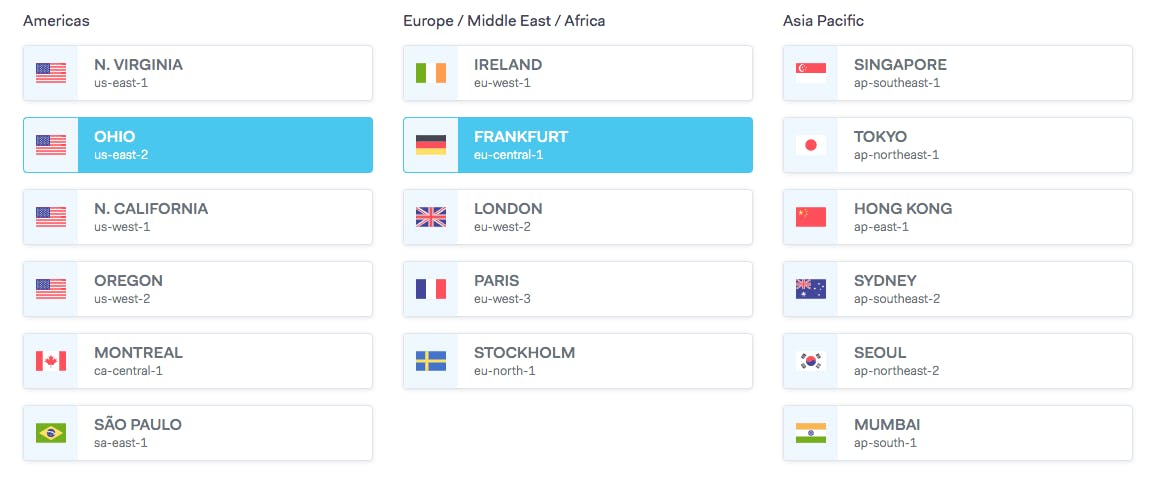
heroku ps:scalecommands. Your bill will also scale up. - You can deploy functions to all regions, enabling you to offer your customers region specificity. Again, if you don't have customers using that region, you pay nothing. But you can still offer it and use it as a sales argument. Setting this up with EC2 would be way more expensive.
So, nothing new there. This is the marketing blurb for any serverless solution. But it is 100% true in my experience. Good job marketing!
Frameworks
To deploy a Lambda function, you can upload a .zip file with your code to S3 or directly to Lambda. I wouldn't recommend that. You will end up writing massive amounts of bash scripts to filter, sort and error check all kinds of things.
At the other end of the spectrum, there are frameworks like Serverless which are a big, complex and try to do everything. Expect lots of YAML engineering and basically leaky abstractions over the different serverless providers. Some love it. I hate it.
I chose Node-Lambda, a Node.js specific toolchain somewhere in between just using the AWS SDK directly and the sprawling jungle of Serverless. Here's why it works for me and for Checkly
- It handles packaging and uploading with retries, error checking and progress meters.
- It only does a single language runtime. This keeps the framework much simpler. Also, it sticks to eco system patterns you are used to and doesn't force you to learn a whole new shitty DSL. If you're using Python or Java there is probably something similar. Notice I really dislike Serverless...
- It has enough hooks to customize the build, i.e: The post install hook allows you to trigger a bash script to modify your package before uploading. I use this to fly in some custom Chromium and cURL binaries that exist outside my normal NPM package.
The only thing missing really was a "build once & deploy multi region" option. But that's just a couple of lines of bash.
#!/usr/bin/env bash

declare -a arr=("us-east-1" "us-east-2" "us-west-1")

npm run package

for i in "${arr[@]}"
do
   AWS_REGION=$i npm run deploy
done
Background jobs
Lambda is extremely well suited for background jobs. Here's why
- Triggering Lambda's by either SNS or SQS messages works absolutely brilliantly. Both SQS and SNS are also extremely simple and stable parts of the AWS ecosystem.
- SNS and SQS both come with various retry and failure modes built in. However, you need to check for idempotency as messages can be delivered more than once in rare cases. In Checkly's use case it's fine if some messages get processed twice. In the 35M+ we ran, this hasn't happend once as far as I can tell.
- Cold start times don't really matter as your job doesn't need to deliver a synchronous response to a user. This is a recurring issue when using Lambda hooked up API Gateway and using it to serve user requests.
- The recent AWS Lambda Layers addition is extremely useful for non-trivial functions. We use it to upload the Chromium binary used by Puppeteer. This means we can iterate on the function's code without having to wait for big uploads on each code push.
- No need to hassle with API Gateway or other — fairly complex — parts of the AWS eco system.
Fan in / Fan out
Here's a diagram of how the Checkly setup works.
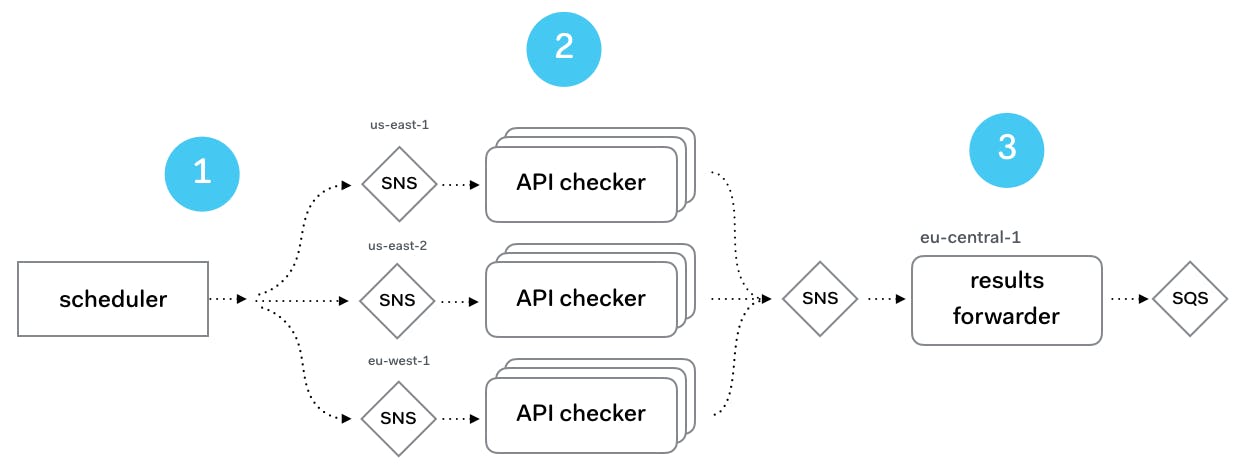
- A scheduler process reads all checks from a database and based on where they are configured to run — remember the region picker? — submits them to an SNS topic in a specific region.
- The API checker function is triggered by the message on this topic and executes the payload. The result is submitted to a single "results" topic.
- The results forwarder function is triggered, post processes the result payload and forwards it to an SQS queue. This queue is processed outside of the Lambda infrastructure where it is stored in the database and used for alerting, dashboards etc.
Notice how extremely decoupled this setup is. It is liberating to be able to swap out components, restart or redeploy parts without work "getting lost".
Synchronous calls
If you use Checkly or even Puppeteer Sandbox you'll notice that the UI has a button to run HTTP requests or Puppeteer scripts in an interactive fashion. This is very useful for debugging your checks, like the example below where a Puppeteer script has an error.
These "ad hoc check runs" as we call them should be executed on exactly the same code base and infrastructure as the non-interactive scheduled checks.
For this to work we do two things:
1. We invoke the function by just using the standard AWS Node.js SDK in a simple wrapper class.
const Aws = require('aws-sdk')
const lambda = new Aws.Lambda()
export default class ApiCheckRunner {

  constructor () {
    this.params = {
      FunctionName: 'api-checker'
      InvocationType: 'RequestResponse',
      LogType: 'None'
    }
  }

  run (check) {
    return new Promise((resolve, reject) => {
      this.params.Payload = JSON.stringify(check)
      lambda.invoke(this.params, (err, res) => {
        return resolve(JSON.parse(res.Payload))
      })
    })
  }
}
2. In the function code, we check if the function is triggered by direct invocation or by an SNS message. We do this for various reasons. Mostly because we don't want to submit the results of the debugging checks to the downstream metrics handling and have them end up in the "official" results.
async function handler (evt, ctx) {
  const isSnsMessage = evt.Records && evt.Records[0].EventSource === 'aws:sns'

  if (isSnsMessage) {
   	// handle as non-interactive background job
  } else {
    // handle as ad hoc, interactive call
  }
}
Monitoring
Monitoring and logging on AWS Lambda is not top notch, but admittedly it is getting better. What are the issues?
- AWS Cloudwatch Logs is terrible. The search is terrible, the layout is terrible, the filtering is terrible. It is really a last resort for debugging weird issues. If you can, plug in a third party solution like Papertrail.
- AWS Cloudwatch Metrics is not bad. It's usable and getting better all the time. But it doesn't do cross regions metrics. So no way to look at the Lambda error rate in us-east-1 and us-east-2 in one graph. Admittedly, this is how AWS regions work for the whole ecosystem.
- You can have your own, custom metrics next to AWS native metrics but IT'S EXPENSIVE! Say you record 1 custom metric per second. That's 60 * 60 * 24 * 30 = 2.592.000 data points. AWS Cloudwatch cost would be 2.592.000 * 0,02 = $51 ex. VAT.
For now, I use AppOptics. For under $30 per month it ingests all my relevant Cloudwatch, Heroku and custom metrics and allows me to build custom dashboards.
This in turn allows me to quickly shift between application logic metrics — amount of SMS sent, Slack hooks called etc — and AWS cloud metrics pretty quickly. Here's an example:
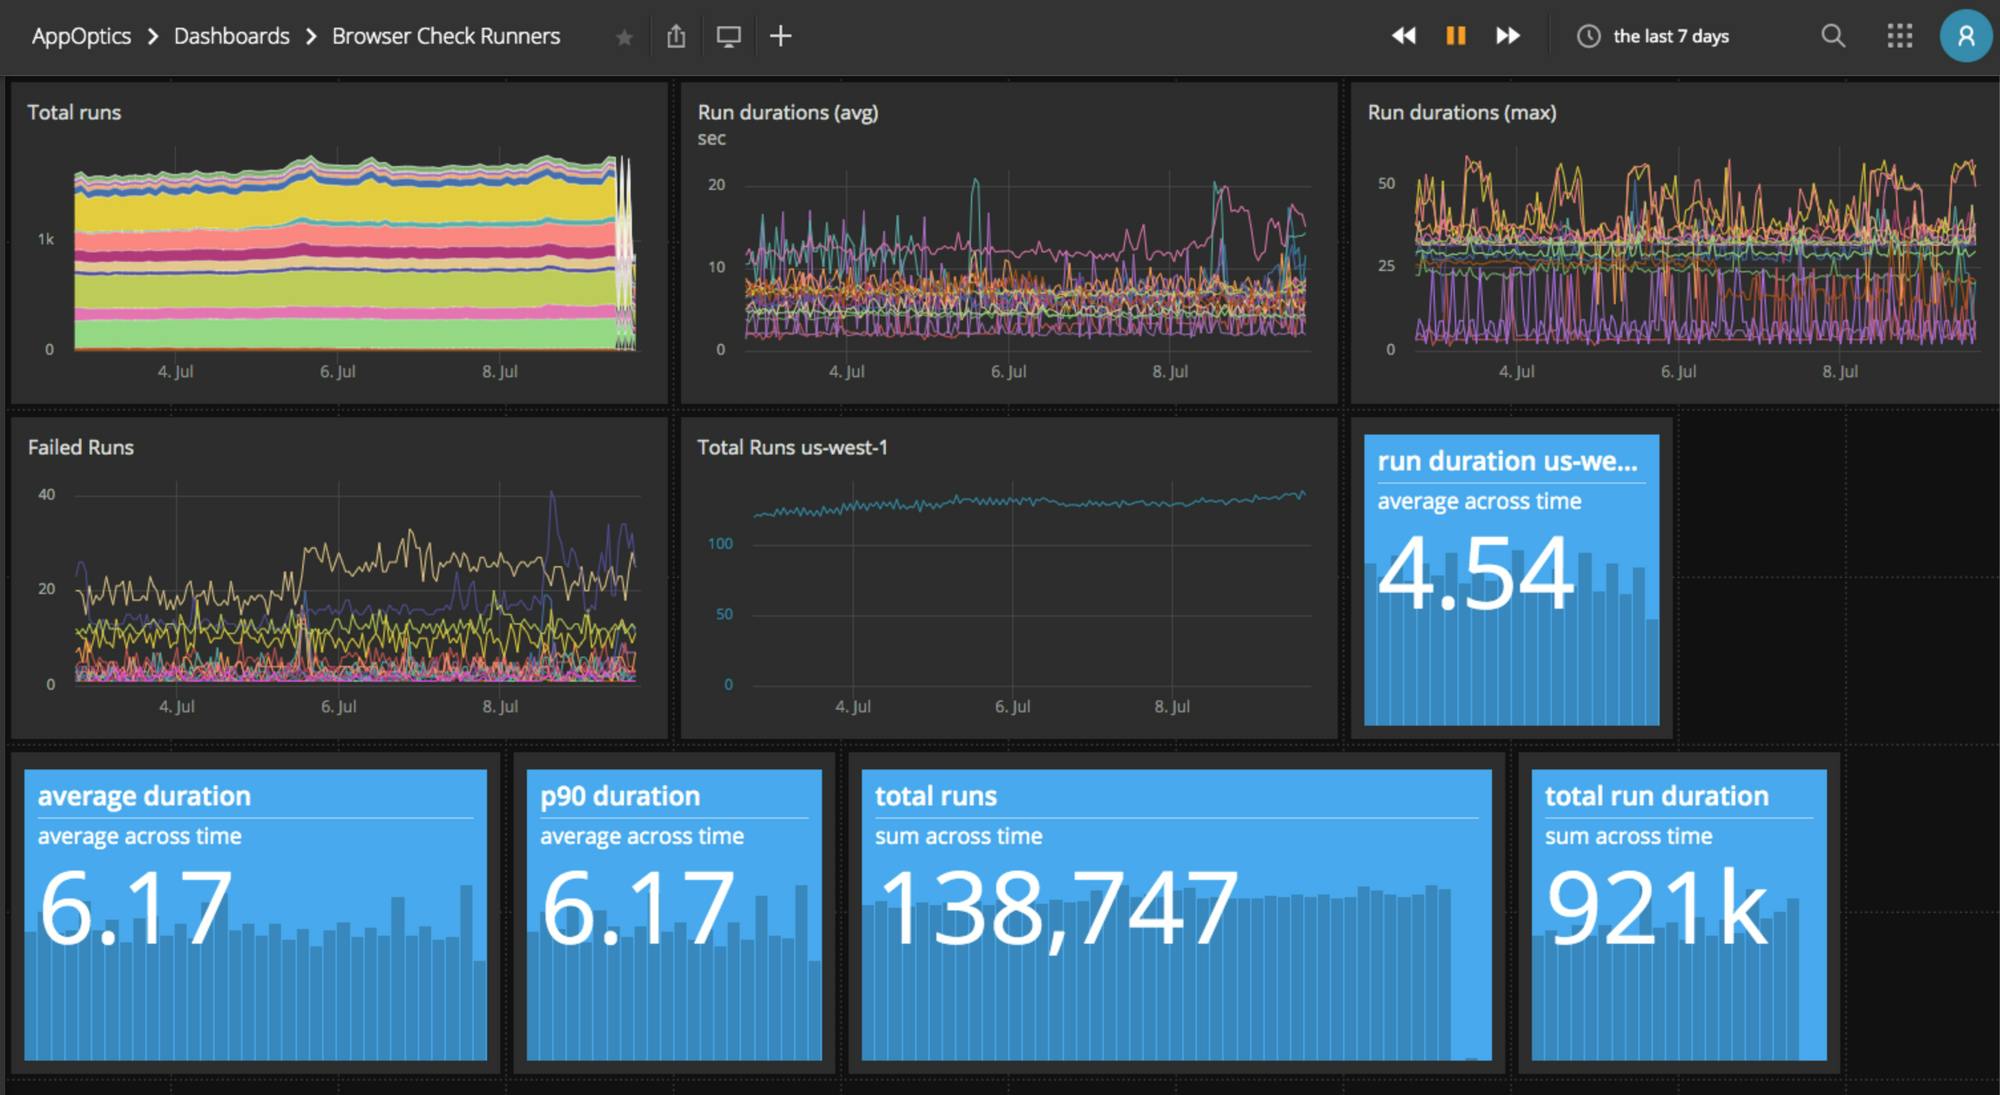
- This dashboard combines straight AWS Lambda metrics with custom metrics. For example "run duration" is a custom metric as the total runtime of the Lambda includes some setup & teardown logic that is not interesting for me to measure. This metric specifically measures how long a Puppeteer session is taking, not how long the total Lambda invocation took. Metrics are recorded using the standard AppOptics REST API.
- The top row of graphs all show Lambda runs over all regions. Super, super useful to instantly see what the busiest region is and where things are going wonky. But we can also pick out a region and have some specific counters on it — see the us-west-1 panels.
banner image: detail from "Spring Rain". Shinsui Ito, 1898-1972, Japan. Source