
We just shipped three updates based on customer feedback.
Alerting when a check fails to schedule
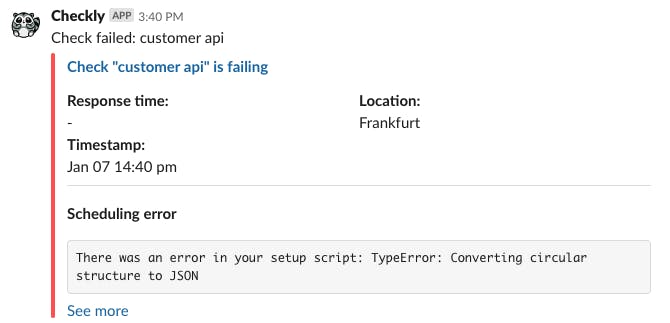
We saw some cases where an API check failed to run because there was an issue with the code executed in the setup script. However, we did not alert on this. Even more, we did register this error in the editor, so the experience was not as expected.
With this update, any check that fails to schedule will trigger an alert on all configured alerting channels with an explicit scheduling error. Here as an example from Slack.
Read more on how we run checks here.
Degraded recovery exposed on webhooks
Webhooks did not discriminate between a check recovering from a hard failure and a degradation because we did not expose that alert type. Now we do.
Alert types now are “ALERT_FAIL”, “ALERT_RECOVERY”, “ALERT_DEGRADED” and “ALERT_DEGRADED_RECOVERY”
Degraded status on dedicated Prometheus gauge
We exposed the degradation status of a check as boolean tag on our Prometheus endpoint.
checkly_check_status{check_name="API Check trigger",check_type="api",muted="false",activated="true",degraded="false" tags="api-checks,triggers,public"} 1This was useful up to a degree but did not allow detailed inspection, filtering and aggregation of this status in tools like Grafana. Together with customer Nomanini we decided to treat "degraded" as its own distinct status. 1 indicates non-degraded, 0 indicates degraded.
For example:
# HELP checkly_check_degraded_status The degraded status of the last check. 1 is not-degraded, 0 is degraded
# TYPE checkly_check_degraded_status gauge
checkly_check_degraded_status{check_name="API Check trigger",check_type="api",muted="false",activated="true",degraded="false" tags="api-checks,triggers,public"} 1
That's it for now!