

Table of contents
Our recent speed comparison of major headless browser automation tools, namely Puppeteer, Playwright and WebDriverIO with DevTools and Selenium, received a very positive response. The single most common ask from our readers was that we follow up by including Cypress in our benchmark. In this article, we are doing just that - with some precautions.
Note: In case you haven't read our first benchmark, we recommend going through it as it contains important information on the hows and whys of our testing which we have decided not to duplicate in this second article.
Why compare these automation tools?
Aside from the sheer curiosity about which was fastest in end-to-end scenarios, we at Checkly wanted to inform our future choices with regards to browser automation tools for synthetic monitoring and testing, and we wanted to do that through data-backed comparisons.
Before we add Cypress to the mix, we need to consider the following key differences to be able to contextualise the results we will get.
Laser focus on testing
Contrary to the tools mentioned above, Cypress is not a general-purpose browser automation tool, but rather focuses on automating end-to-end browser tests. This narrower scope enables it to excel in areas of the automated testing domain where other, more general-purpose tools have historically struggled.
In the author's opinion, the most evident example of this is Cypress' unmatched E2E script development and debugging experience. It is important to note that this kind of qualitative characteristic cannot be highlighted in a speed benchmark such as the one you are reading right now. The goal of this benchmark is to answer the question "how fast does it run?" and not "which tool is the best all around?"
Local testing flow
As mentioned on the official documentation, while Cypress can be used to test live/production websites, its actual focus is on testing your application locally as it is being developed.
This benchmark is set up for running against live environments (Checkly itself is used for production monitoring), and therefore will test Cypress on this use case only, exposing a partial picture of its performance.
Methodology, or how we ran the benchmark
Note: If this is the first time reading this blog, we recommend taking a look at the full version of our methodology writeup from our previous benchmark, as it is important to better understand the results.
Once again, we gathered data from 1000 successful sequential executions of the same script. To keep things consistent, we kept our guidelines and technical setup identical to our previous benchmark, with the exception of two added packages: cypress@6.2.1 and jest@26.6.3.
Cypress was run using the cypress run command, and all scenarios have been executed without any kind of video recording or screenshot taking.
The results
Below you can see the aggregate results for our benchmark. For the first two scenarios, we kept the results for from our previous benchmark and added fresh data for Cypress. The last scenario is based entirely on new executions. You can find the full data sets, along with the scripts we used, in our GitHub repository.
Scenario 1: Single end-to-end test against a static website
Our first benchmark ran against our demo website, which is:
- Built with Vue.js.
- Hosted on Heroku.
- Practically static, with very little data actually fetched from the backend.
This first scenario will be a short login procedure. Having a total expected execution time of just a few seconds, this test is run to clearly highlight potential differences in startup speed between the tools.
The aggregate results are as follows:
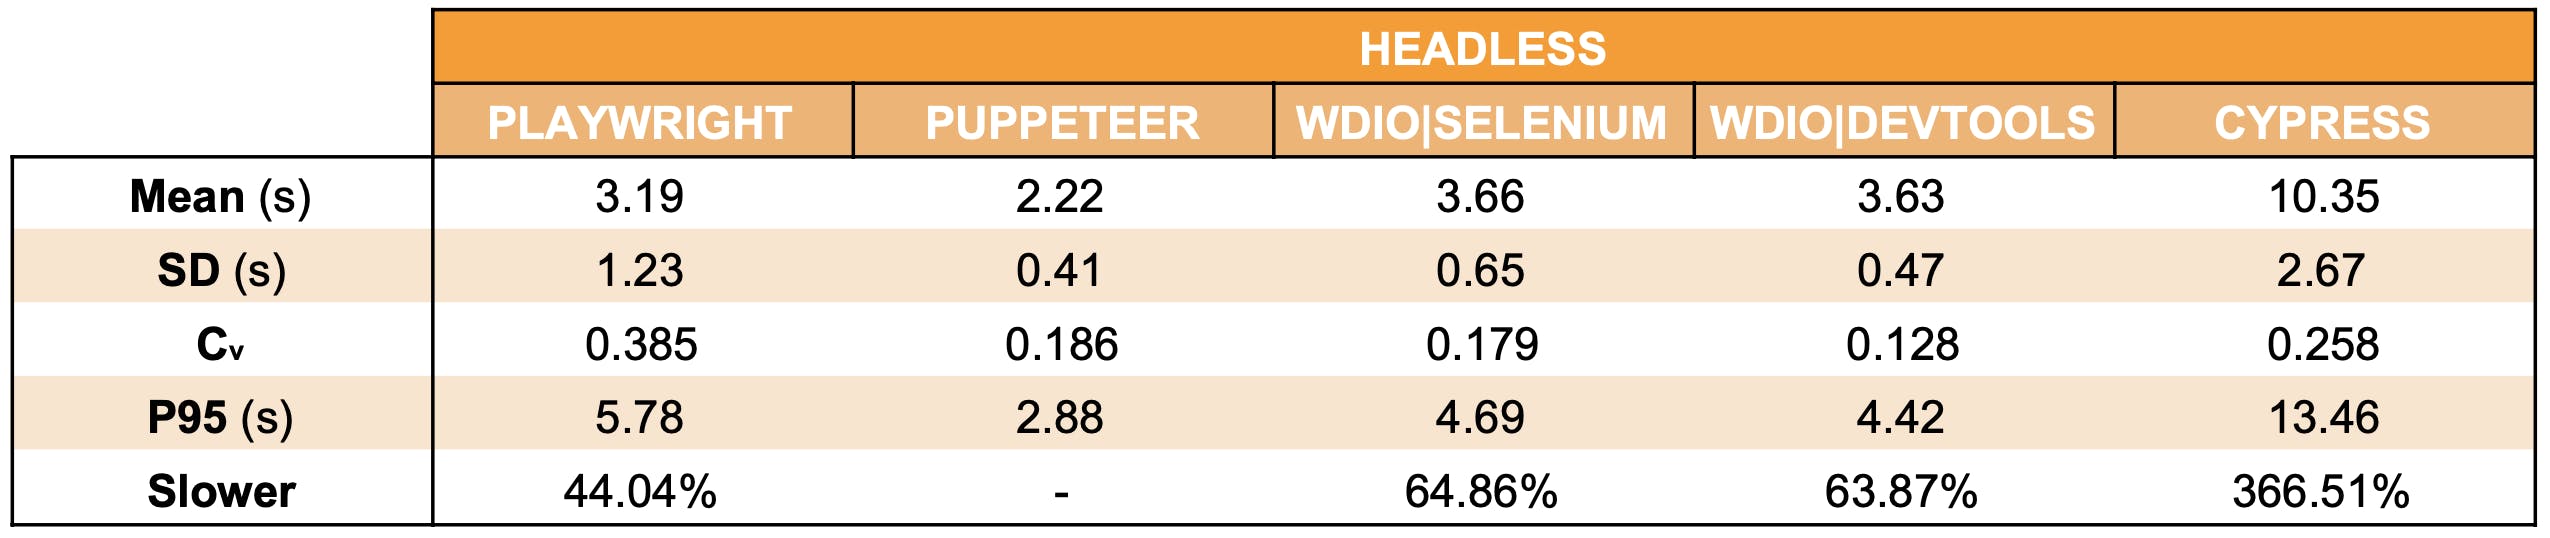
While no large startup time difference had been revealed in our first benchmark, here Cypress seems to exhibit a markedly longer startup time compared to the other tools. Cypress' own reported execution time, ~3s in the case of this test, implies ~7s needed until the test can start running.
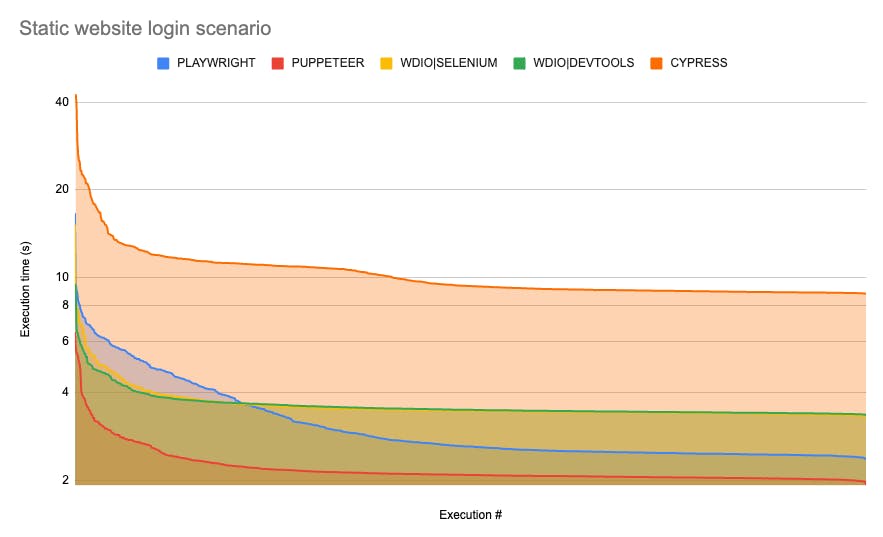
Ordering execution time data points from larger to smaller, we can more clearly see the separation between the different tools:
This kind of very short scenario is where the difference in startup time will be felt the most; on average, Cypress is close to 3x slower than WebDriverIO+Selenium, the slowest tool in this test, and more than 4x slower than Puppeteer, the fastest tool in this comparison.
Our next scenario has a longer overall execution time, therefore we expected the above ratios to decrease.
Scenario 2: Single end-to-end test against a production web app
Our second benchmark ran against our own product, app.checklyhq.com, a full-blown web application which sports:
- A Vue.js frontend.
- Heroku hosting.
- A backend which heavily leverages AWS.
- Dense data exchange between backend and frontend, animations, third party apps and most of the components you expect from a production web app.
The second scenario is a longer E2E test which:
- Logs in to app.checklyhq.com.
- Creates an API check.
- Deletes the check.

The aggregate results are as follows:
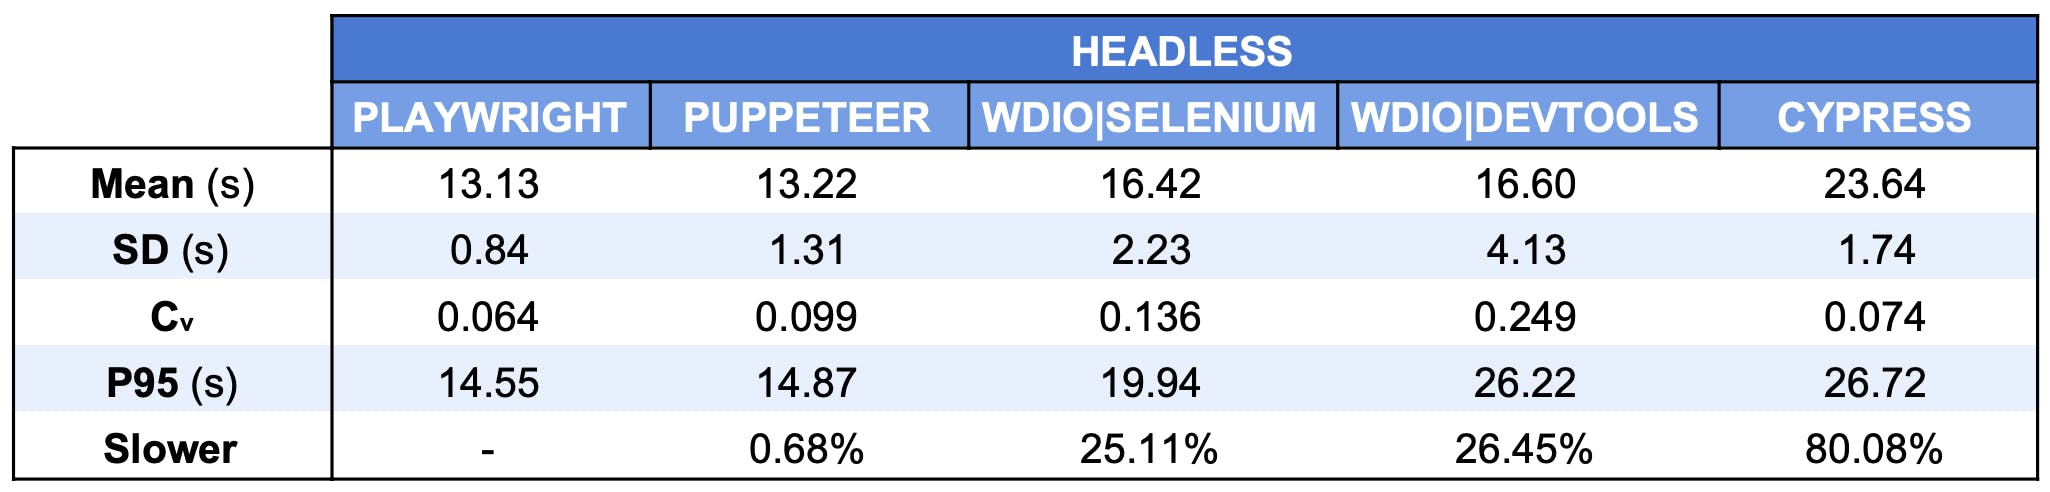
As we can see, the separation between Cypress and the rest of the tools remains. It is also consistent with our previous finding about the startup time: on average, it seems to be ~7s slower than WebDriverIO on this test, too.
The relative result is indeed closer compared to our previous scenario: here Cypress is, on average, not even 2x slower than the fastest tool (now Playwright), whereas before it had been 4x slower.
So far, we had only executed single-scenario tests. This is where our previous benchmark stopped. This kind of setup surfaced interesting information, but did not cover the very frequent case where multiple tests are run in a row, as part of a suite. We were particularly interested in seeing if Cypress would regain ground when running multiple tests sequentially, so we produced a new dataset for Cypress and all the tools previously included. That makes up our third scenario.
Scenario 3: Test suite against a production web app
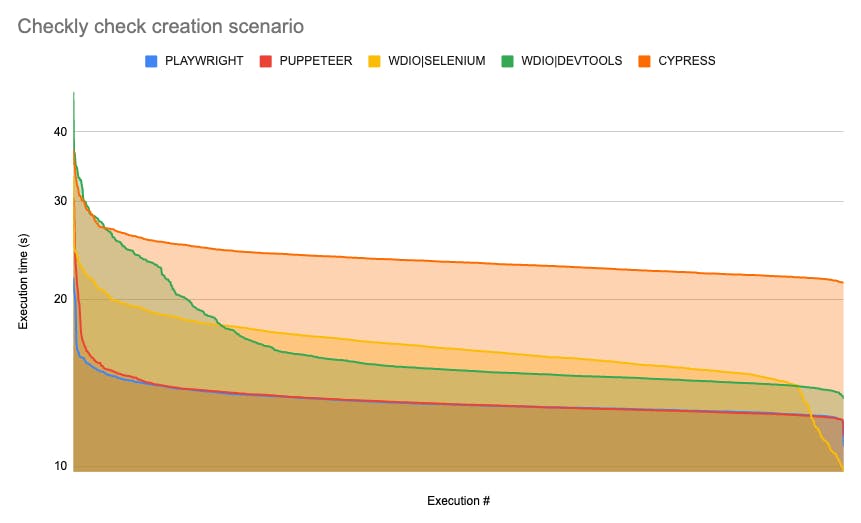
Our suite included our check creation scenario, just seen in the last section, and two brand new E2E scripts, both going through login, asset creation (respectively alert channels and snippets), and deleting them afterwards.
For Puppeteer and Playwright, we executed suites using Jest. For all other frameworks, we used the built-in features they already came with.

The aggregate results are as follows:
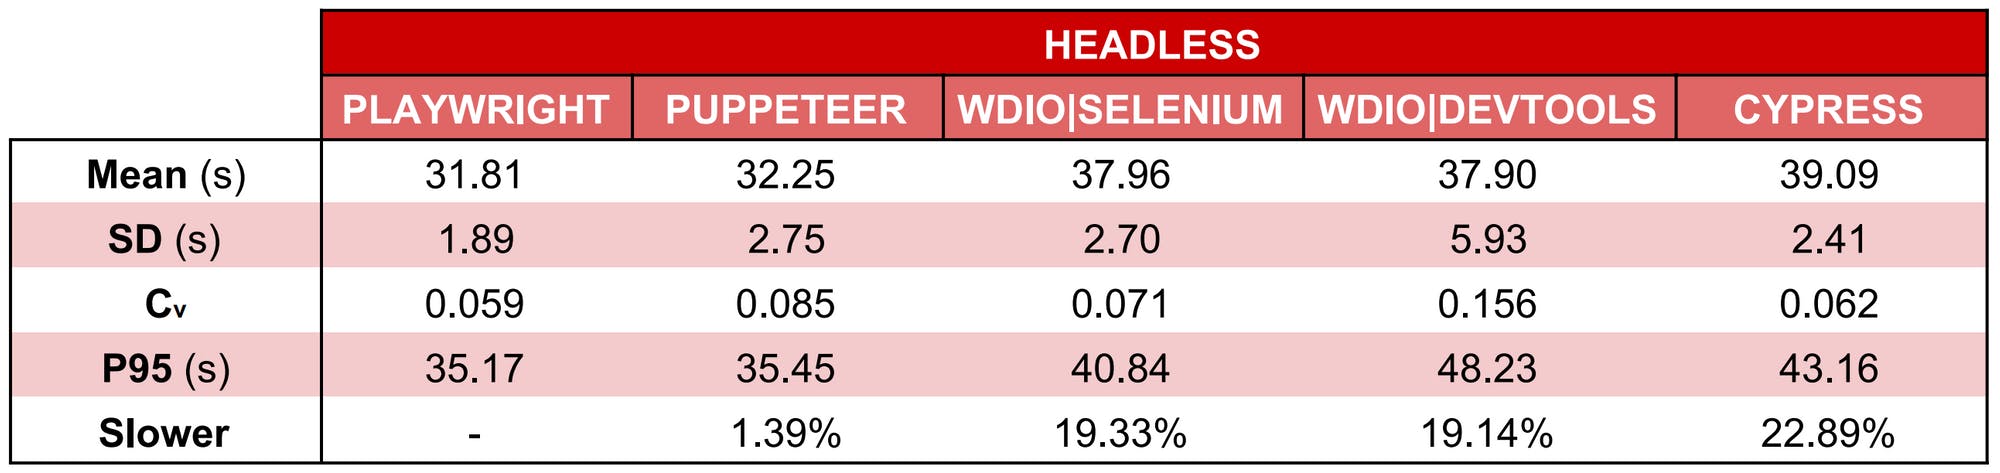
We can see that the difference between Cypress and the other tools is now considerably lower, with the mean execution time over 1000 executions being just ~3% slower compared to WebDriverIO+Selenium (the slowest tool in this run), and ~23% slower compared to Playwright (the fastest).
The smaller spread is also visible on our comparative chart...
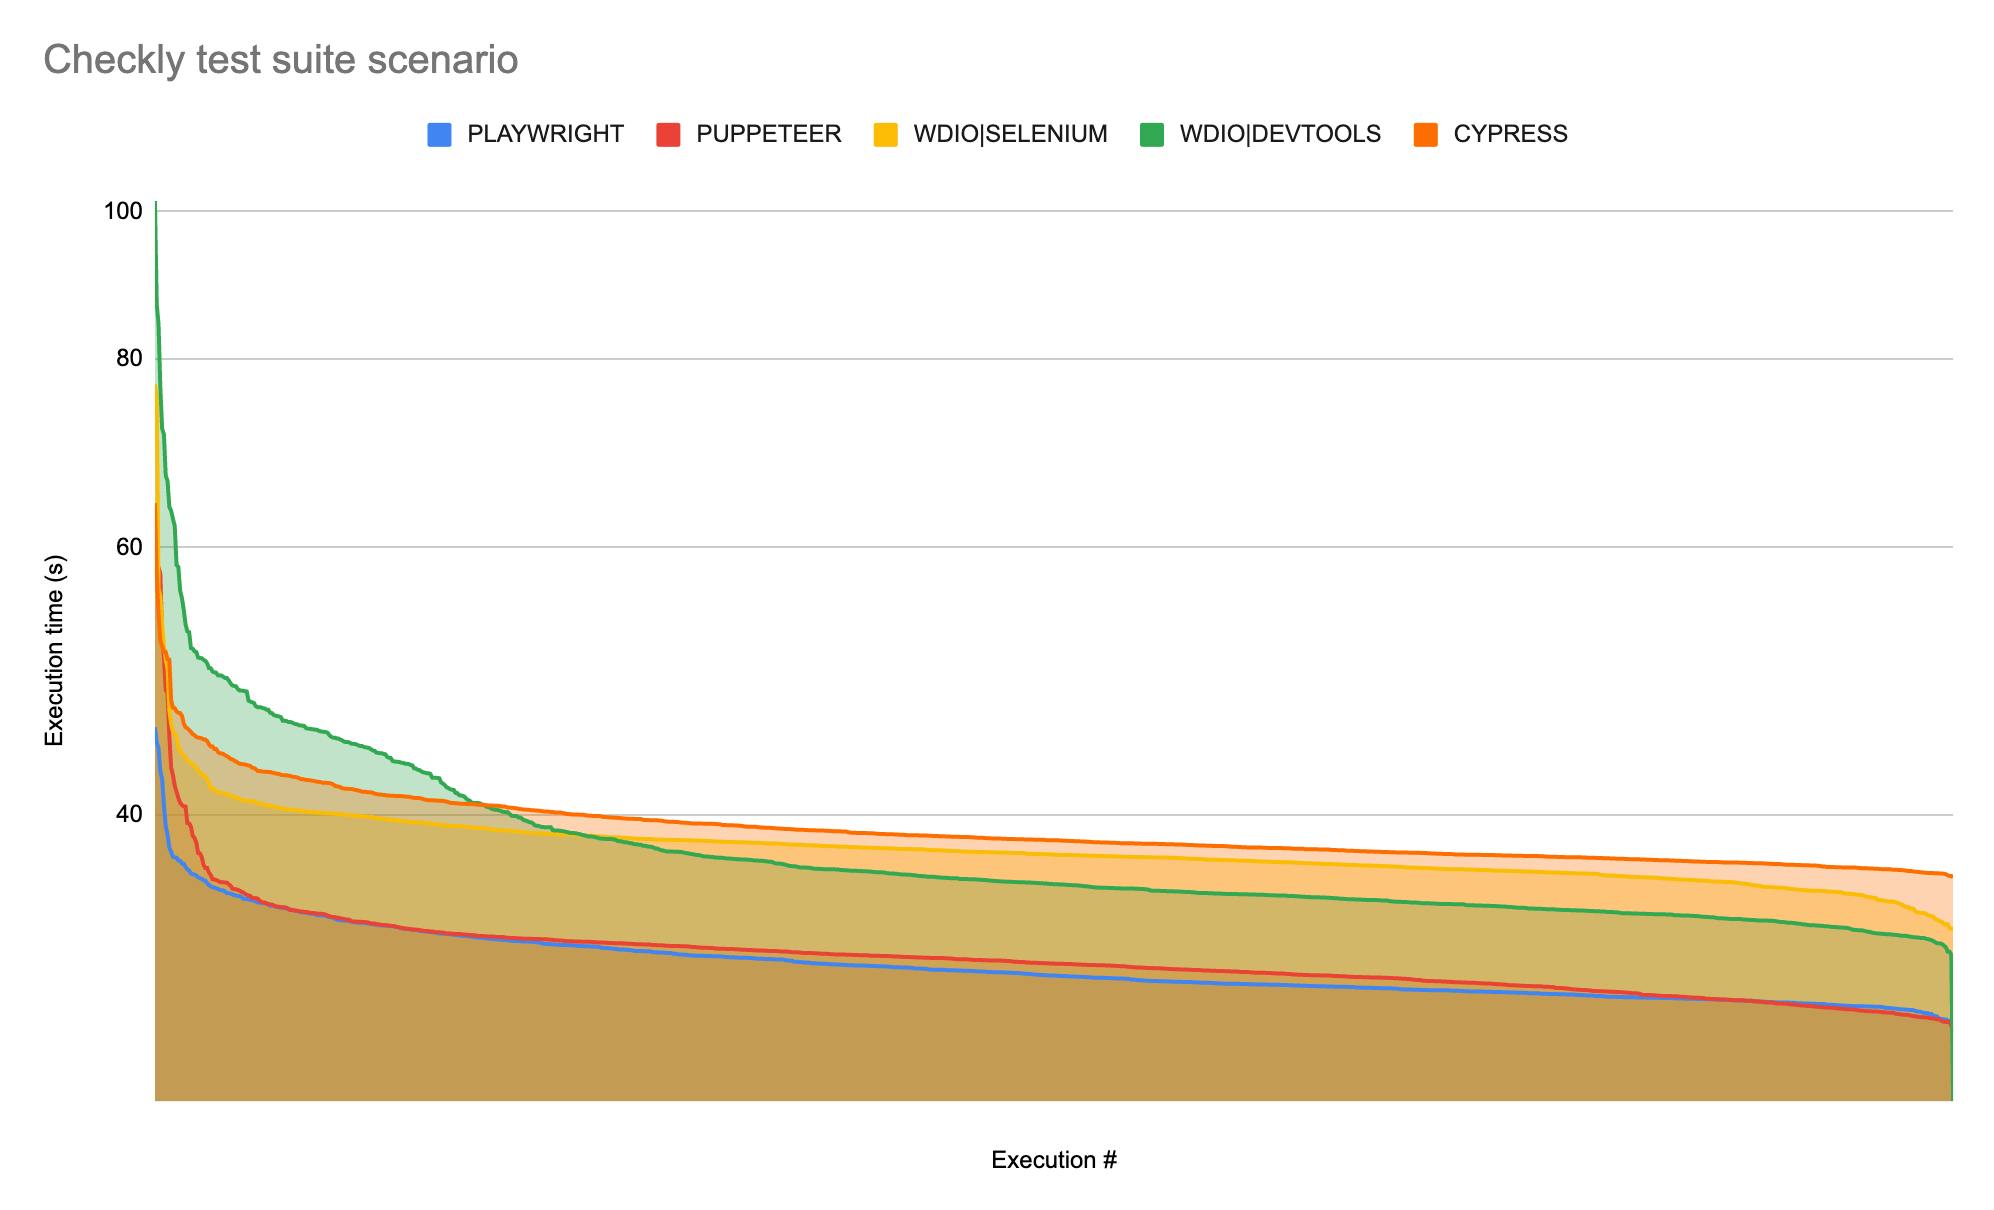
...where excluding the values above 50s allows us to "zoom in" and better see the small difference between Cypress and WebDriverIO:
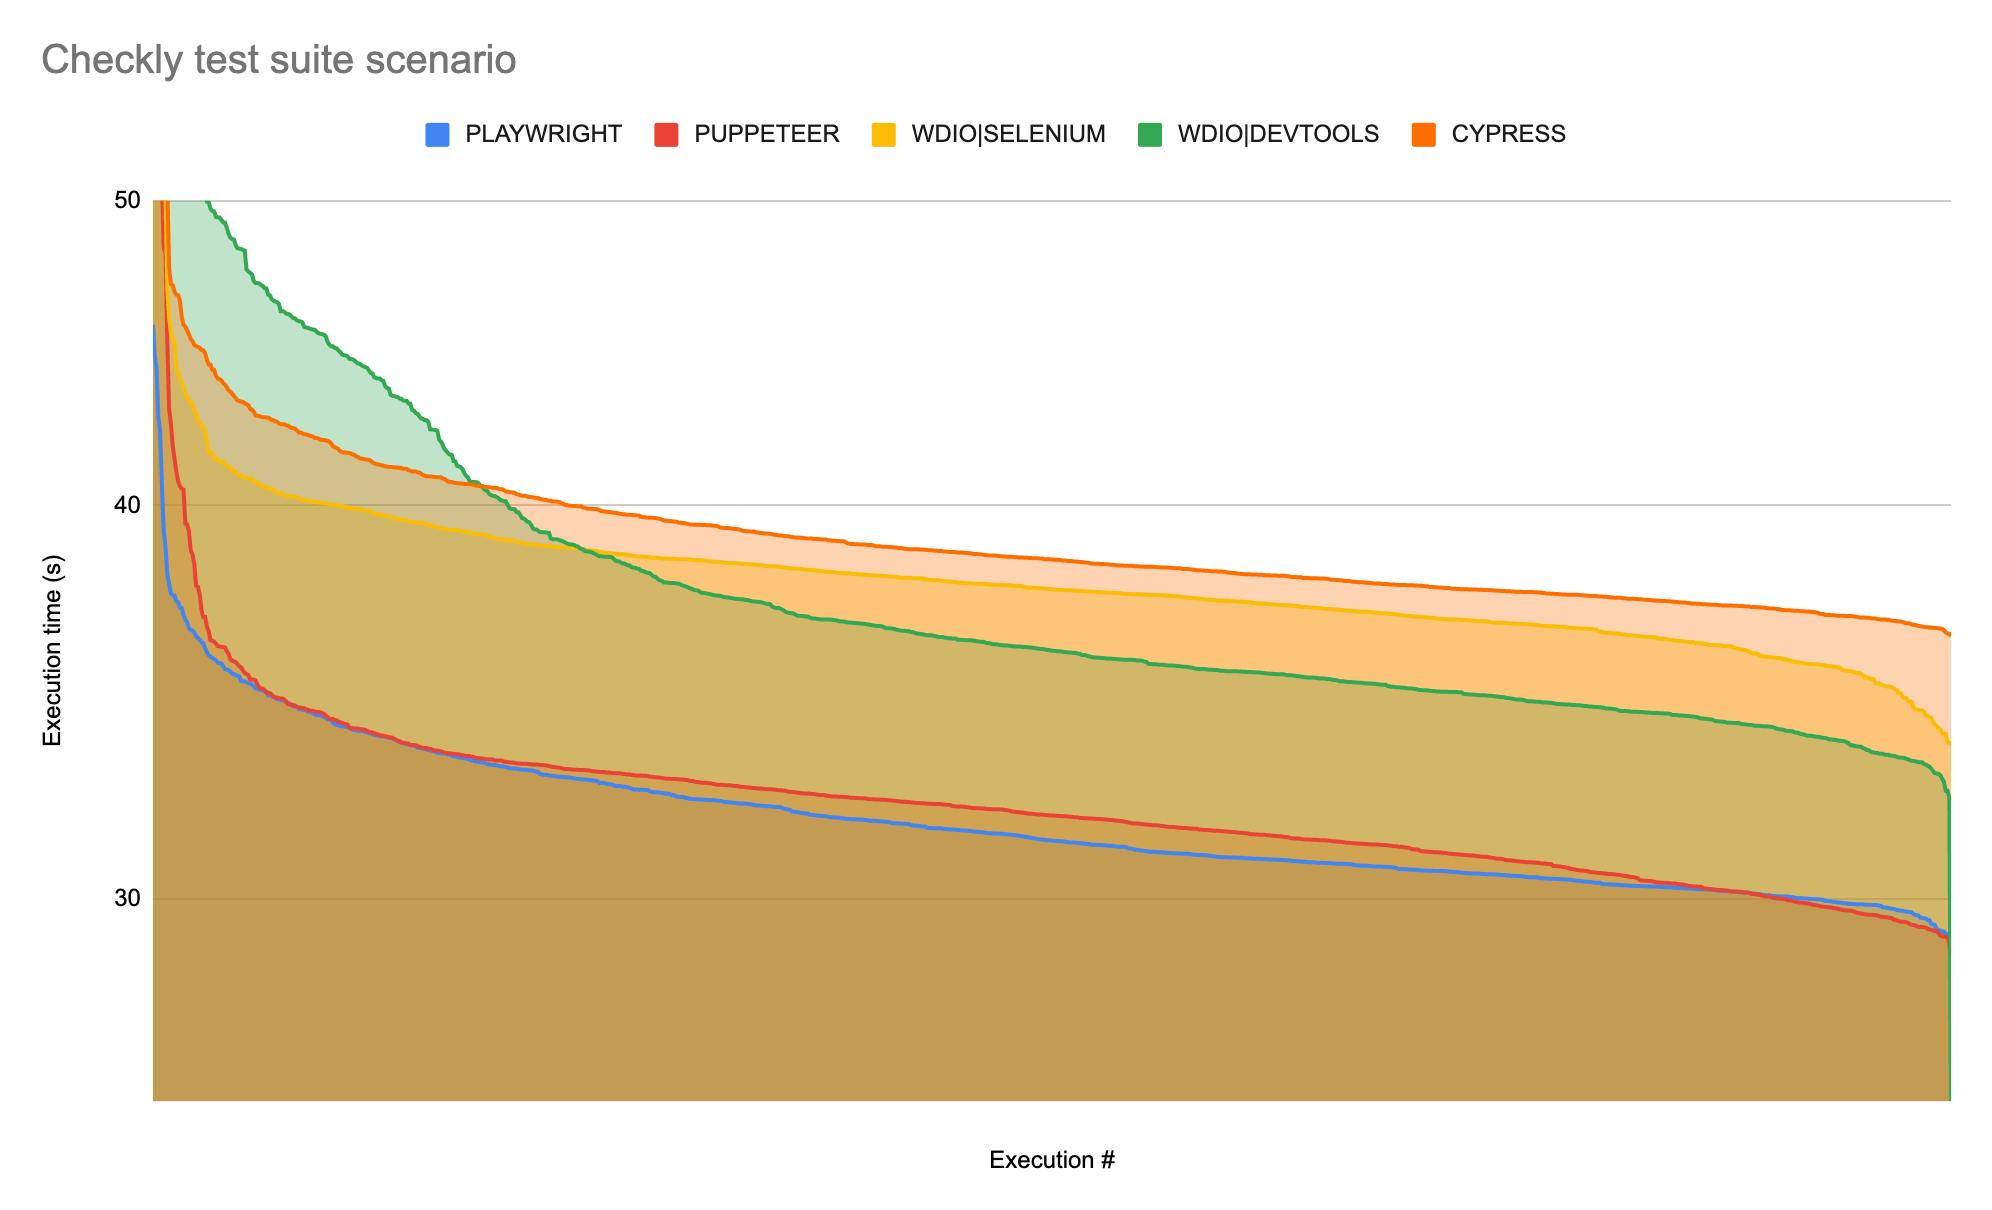
An interesting if secondary observation is that WebDriverIO running the DevTools automation protocol seems to consistently exhibit a higher degree of variability in its execution timings. The only scenario in which this did not seem to be the case was the first one, when we were running a very short test against a static site. In the case of our test suite run, the green peak in our first chart is highlighting this finding.
Have doubts about the results? Run your own benchmark! You can use our benchmarking scripts shared above. Unconvinced about the setup? Feel free to submit a PR to help make this a better comparison.
Conclusion
It is time to summarise mean execution timings for our scenarios side by side.
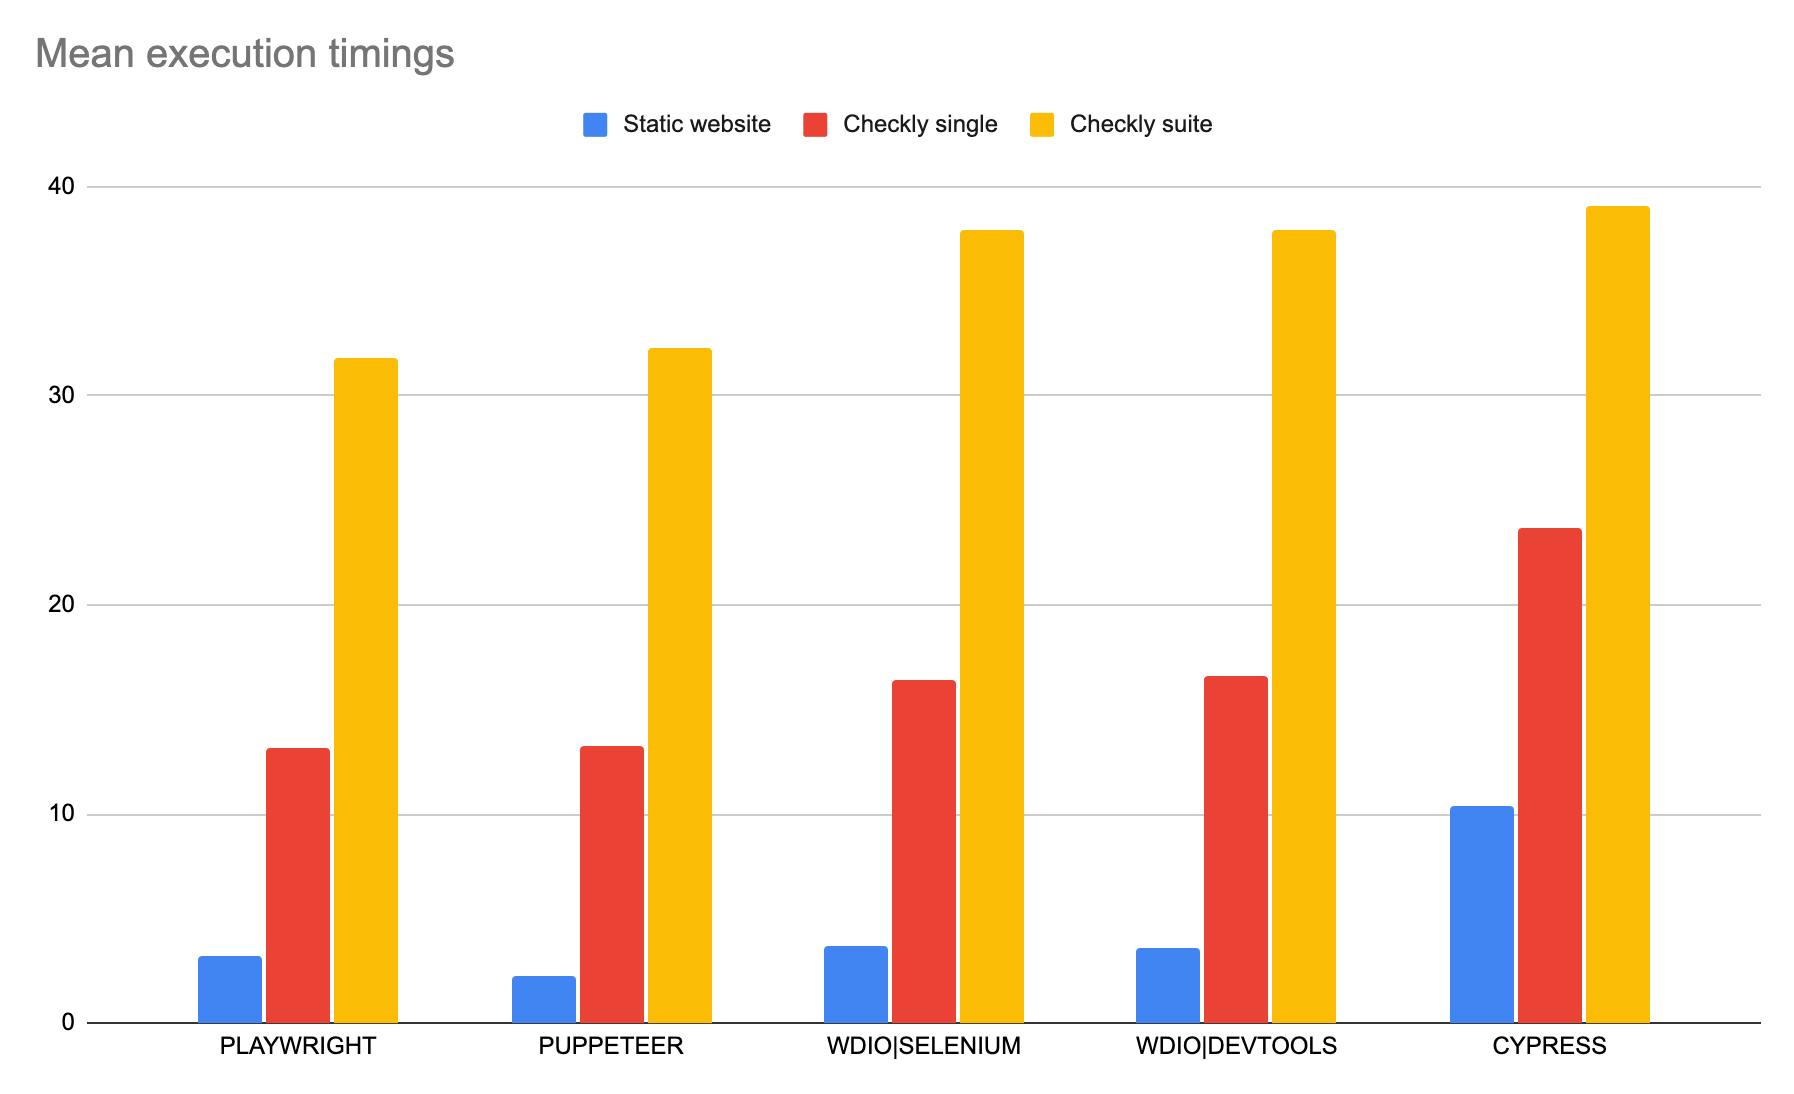
The final performance ranking is as follows:
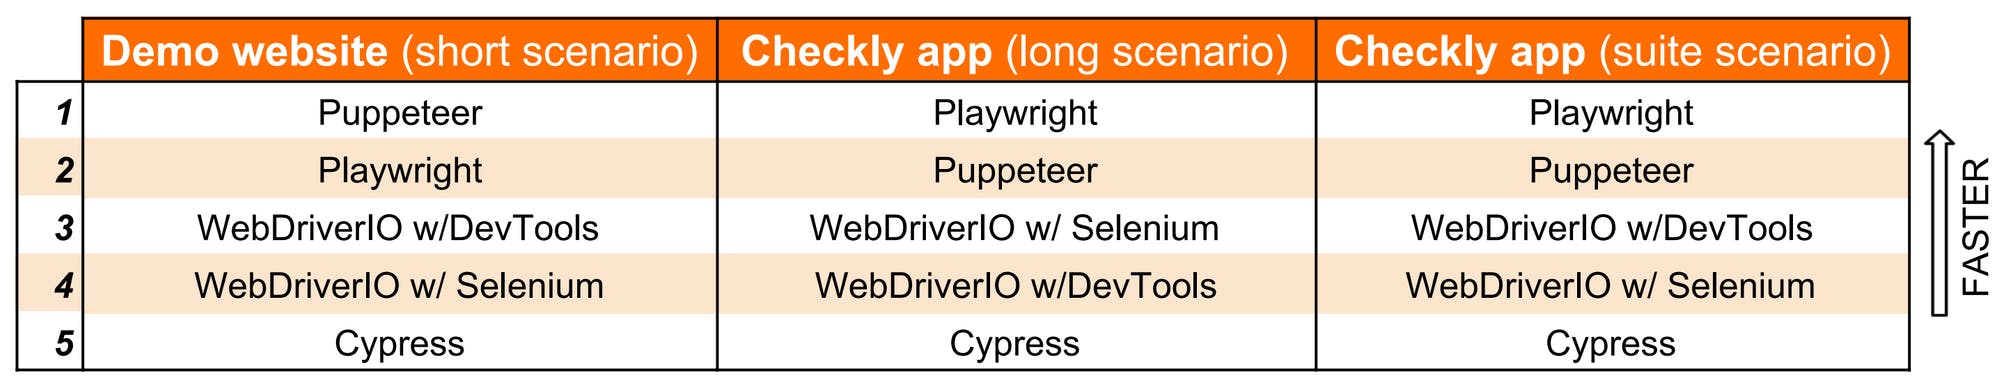
In conclusion, our second benchmark showed the following findings:
- Cypress exhibits a longer startup time compared to the other tools listed so far. This weighs down short execution scenarios, while it shows less in longer ones.
- Cypress seems to be approximating Selenium speed in longer suites, which are the norm in E2E testing. It remains to be seen whether very long-running suites could see Cypress climb up the ranking.
- Puppeteer's advantage over Playwright in short tests does not translate to longer executions. Playwright tops the ranking for real-world scenarios.
- Playwright and Puppeteer show consistently faster execution times across all three scenarios.
- Across real-world scenarios, Playwright showed the highest consistence (lowest variability) in execution time, closely followed by Cypress.
Takeaways
- Be mindful of Cypress' sweet spot: local testing is what will enable to use it to its fullest potential. It will still perform well with live websites, but might not be the fastest option.
- Cypress' high startup time might interfere with high-frequency synthetic monitoring scenarios, but is not likely to make a real difference in the context of classic E2E testing builds.
- Playwright currently seems like the obvious choice for synthetic monitoring of live web applications.
If you are reading this article to help inform your choice of an automation tool, make sure you integrate any takeaways with considerations relative to your own use case. Speed is important, but ease of script development and maintenance, stability, feature set and so on need to be considered as well, and the best way to assess those is to try out the tools with your own hands.
If you have comments, suggestions or ideas for benchmarks you would find helpful, please reach out to us on Twitter at @ChecklyHQ, or email the author at giovanni@checklyhq.com. Stay tuned for further automation benchmarks.
banner image: "Moonlight Revelry at Dozo Sagami". Kitagawa Utamaro, 18th/19th century, Japan. Source