
Today, I'm excited to share the release of a long-planned and requested feature - our new Check Overview Page.
Until now, Checkly enabled you to troubleshoot single alerts, but a deep dive into the long-term performance trends was limited. That is not the case anymore.
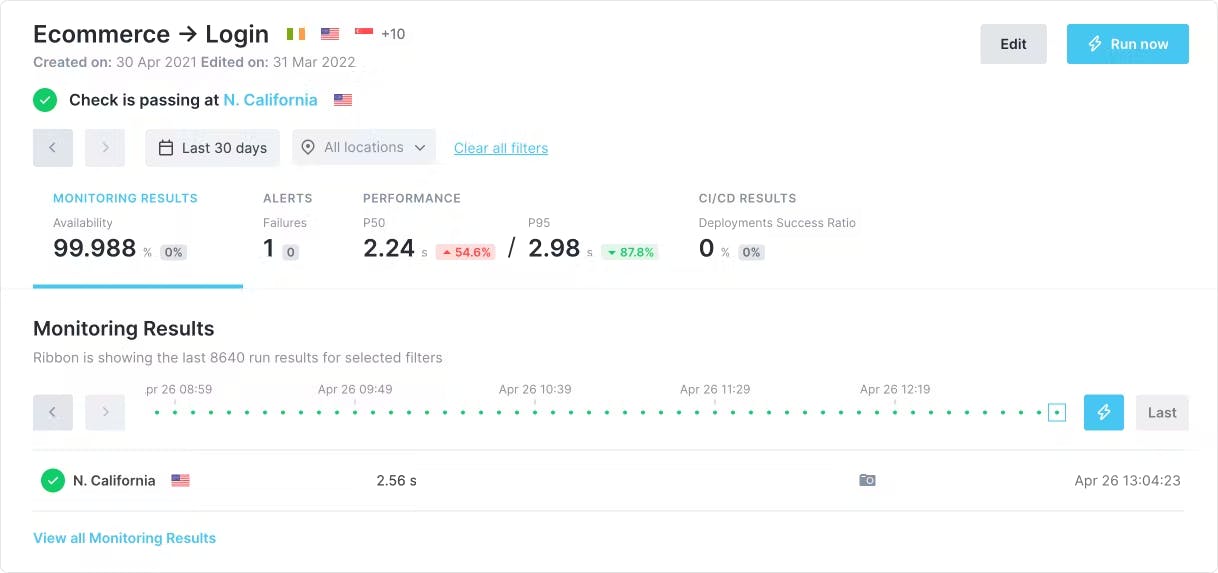
In the new Check Overview, we’re introducing the enhanced analytics in four distinct categories:
- Monitoring results
- Alerts
- Performance
- CI/CD Results
The update is focused on two important outcomes:
- Provide a quick at-a-glance overview of how a check is performing right now and enable fast troubleshooting.
- Give the contextual data to investigate and explore trends.
What's new
This update helps identify the root cause of a problem and provides a clear view of the history behind it.
We want you to be able to:
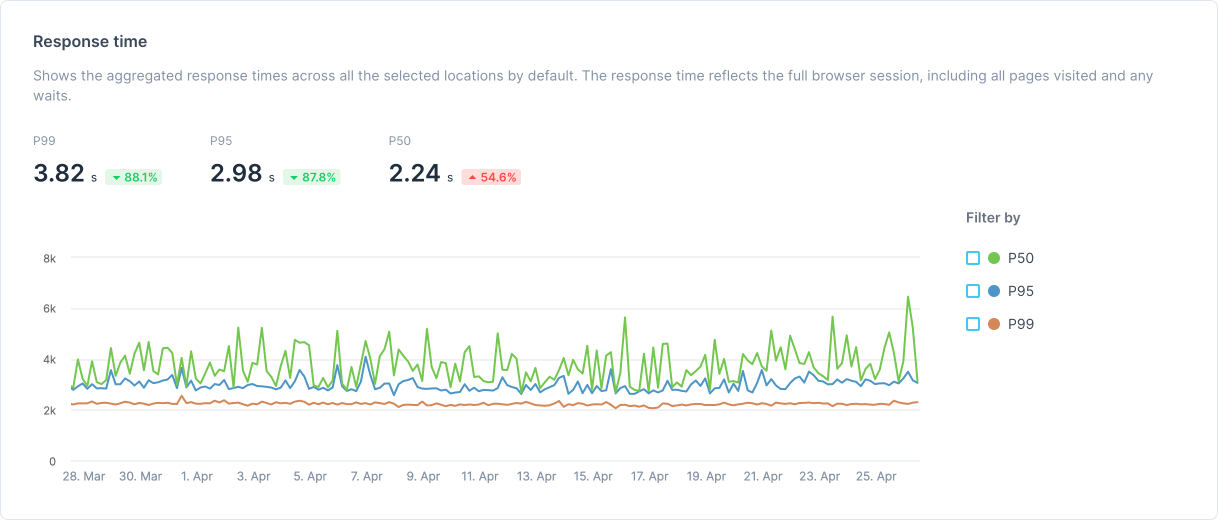
- Analyze long-term reliability trends for patterns and insights regarding response times and uptime
- Reference an active outage in the context of historical trends
- Make the above possible through the public API as well.
From now on, you can:
- Slice and dice availability and performance metrics over an arbitrary time range and run locations.
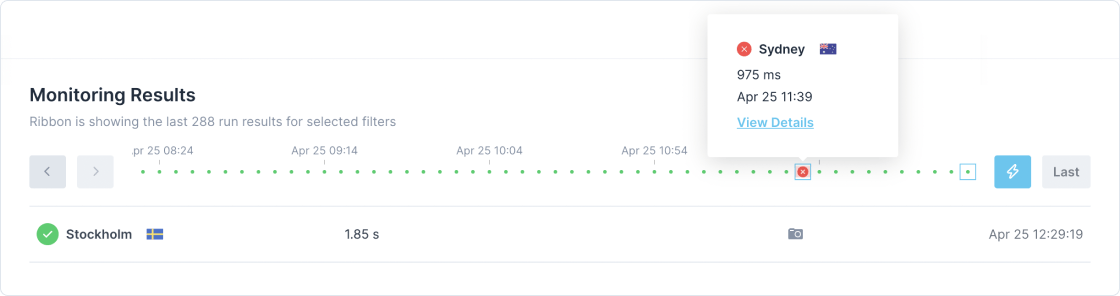
- Get to recent failures much quicker than before! The new Ribbon gives you direct feedback at the top of the page on what happened recently to your checks. See below 👇
3. Get Browser and API checks specific stats
- For API checks we give you a breakdown of API response times per timing phase (Wait, DNS, TTFB, TCP, Download)
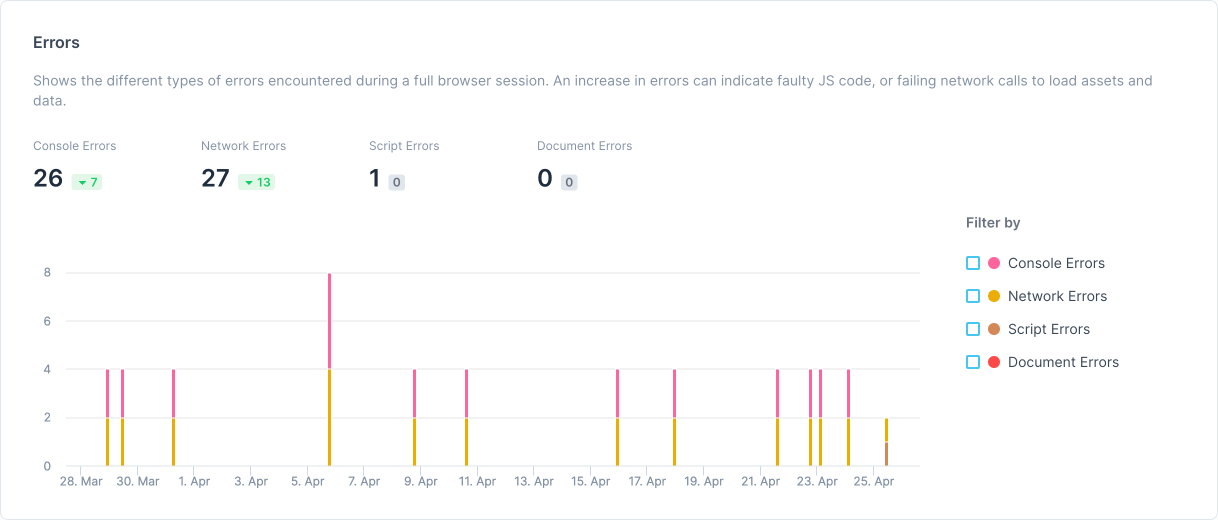
- For Browser Checks we give you a breakdown of Core Web Vitals (TTFB, FCP, LCP, TBT, and CLS.) and errors (Console, Network, Script, and Document).
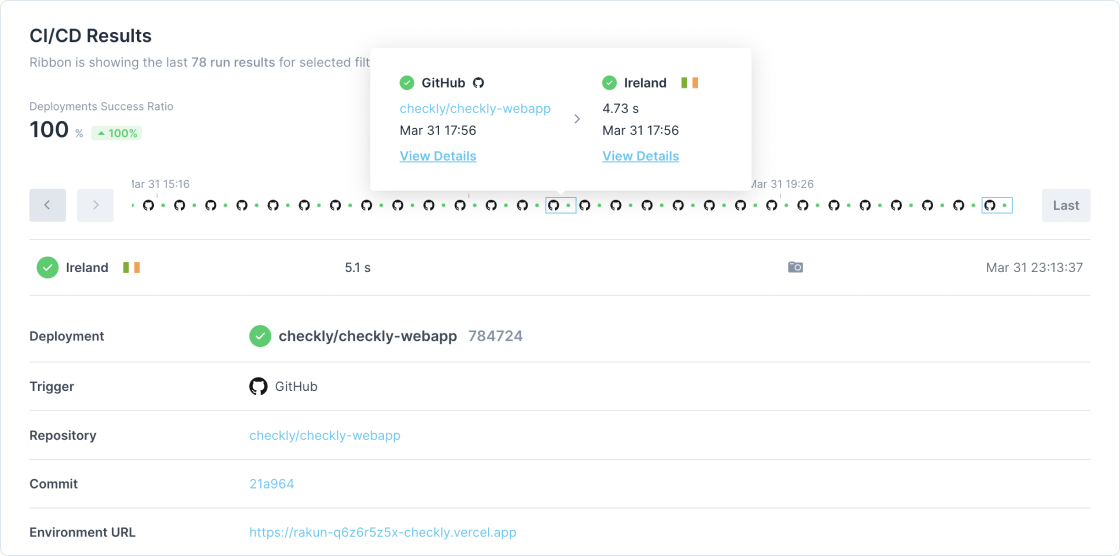
4. Access the stats on CI/CD Results in a dedicated section. Those results can come from our integrations (Vercel, GitHub and Command Line). All the deployments can be seen in the ribbon.
5. Quickly compare high-level performance stats across all regions in the “All Locations” section.
6. Access all check results in a simple table. We removed the 2-hour limitation for data recency. You can filter the data per location, time range, and check results status.
All this implies Checkly’s transition from a problem monitoring to a problem identification & solving platform.
Who can use it?
The new Check Overview is accessible to all users on all plans at no additional cost. You can access this feature by clicking on a check on your home dashboard.
We look forward to hearing what you think, and what other metrics we should collect!